What is EEG

Electroencephalogram (EEG)
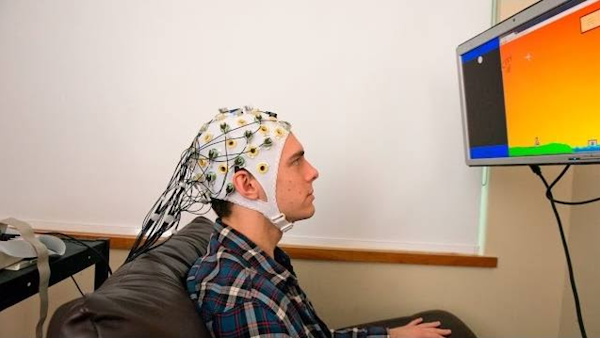
As the name implies, electroencephalogram (EEG) is a tool that records the electrical signals generated from neuronal activation in the brain. Simply speaking, EEG detects the brain activity and shows its activity signals to us. Since brain signals activated in specific experimental circumstances provide numerous information to researchers, EEG has been applied in many fields such as psychology, pathology and YES linguistics. If you haven’t seen EEG before, you might be wonder how it looks like and what it exactly does. From now on, I will explain it to you.
EEG is not a huge machine but pretty compact one that is separated into several parts.
- The most expensive and important part in the EEG tool is an amplifier. As you can see in Figure 1, this small rectangular box is an amplifier. This tool amplifies the captured brain signals from the subject (a person who participates in experiment)

Figure1. EEG Amplifier
Since the brain’s electrical voltage is very low, this amplifier plays an important role in collecting brain signals and transferring them to the main computer system. Without this machine, EEG cannot be able to collect the brain signals properly.
- In Figure 2, EEG control box connects EEG electrodes (I will explain it later), amplifier, and the main computer system all together.

Figure 2. EEG ControlBox
There are red, yellow, and green colored slots and by these slots electrodes, amplifier, and the main computer are connected and worked together. You can find a wide cable that connected to an amplifier in Figure 1. This cable directly links to the top of the slot in the control box in Figure 2 and another wide cable (you can see that someone is holding the white line) that attached to black electrode wires in Figure 4, also links to one of the slots. You may wonder what those three colored slots mean by now (actually there are 3 pairs of each colored slot).
- In Figure 3, there is a bunch of electrodes connected to black wires and the number of these electrodes are changed depending on the experiments. This means that the researchers have to choose the number of electrodes first, and then choose the slot that supports the number of electrodes. In my case, I used 32 electrodes in my experiment so I linked 32 electrodes to green colored slot in Figure 2.
- The shape of the electrodes are shown in Figure 3 and 4. Those electrodes detect the brain signals when they attached to the subject’s scalp. In Figure 3, each electrode is consisted of black and white parts. Black part is head of the electrode and it lights up in 3 different colors when it is attached to the human scalp. Red: bad connection, Yellow: instable connection, Green: stable connection. White part has a gray rod at the bottom and this one collects the brain signals. This electrode is connected to the black wire and transmits the brain signals to the control box. Small flags are marked in each wire so that signify the electrode’s unique number.

Figure 3. EEG Electrodes Figure 4. EEG Electrodes
with SplitterBox
Brain signals
Brain signals are electrical pulses so they can be depicted as fluctuation. Figure 5 shows the brain signals fluctuated by the brain activity. Except the fluctuation in the middle area, the brain signals captured by EEG are very smooth and quiet. To be honest, strong signals in the middle area are not marked by the brain activities but eye blinking movements. In this sense, EEG researchers reject the strong fluctuation recored in the signal data and only examine the rest.

FIgure 5. Brain Signals
Conclusion
My explanation may be not enough to make you understand the EEG. However, I would like to continue the talk about EEG more in the next post. By giving you the experiment examples I did before, more detail information will be delivered to make you understand why EEG is being applied in diverse fields.
Hyungwon Yang


댓글
댓글 쓰기